 Copied
Go to and paste the code at the checkout to enjoy
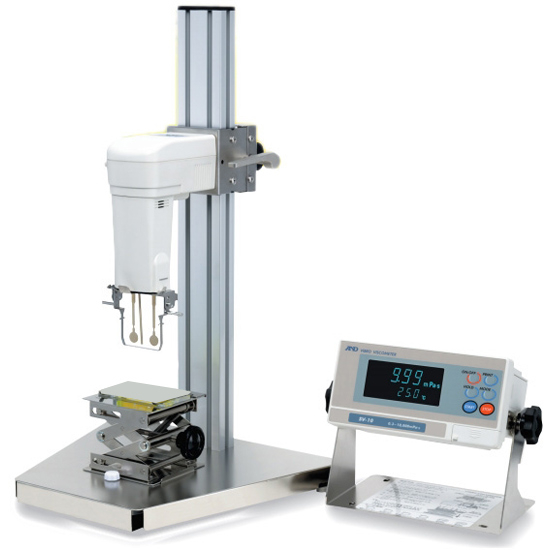
SV Series Sine-wave Vibro Viscometer
Best Price:
Buy SV Series Sine-wave Vibro Viscometer for $3,452.00 at @ Megadepot.com
No coupon is required — this is the standard retail price.
Set a price drop alert to never miss an offer.
Price Comparison
| Seller | Contact Seller | List Price | On Sale | Shipping | Best Promo | Final Price | Volume Discount | Financing | Availability | Seller's Page |
|---|---|---|---|---|---|---|---|---|---|---|
|
BEST PRICE 1 Product Purchase
|
|
$4,080.00 | $3,452.00 |
|
$3,452.00 | See Site | Visit Store |
Product Details
A&D Weighing, SV-10, SV Series Sine-wave Vibro Viscometer, 0.3 cP (mPa.s) ~ 10,000 cP (mPa.s)Newly developed Tuning-fork Vibration Method promises high accuracy and wide measurement range without replacing sensor plates! (Patent pending) IncludesManualAC AdaptorCD-ROM (WinCT-Viscosity) Sample CupsRS-232C Cable (25 pins - 9 pins)FeaturesHigh Measurement AccuracyWide Measurement RangeNon-Newtonian Sample Viscosity MeasurementFoam Sample MeasurementFlowing Sample MeasurementWinCT ViscosityVia an RS232C interface, the WinCT-Viscometer software lets A&D's SV series Sine-wave Vibro Viscometer display measurement progress in real time on a PC, and easily transmit the measured results to save or analyze. The WinCT-Viscometer CD-ROM is a standard accessory with the SV Series viscometer.RsVisco, the graphing software utilized by WinCT-Viscometer, lets you create graphs of measured results and of the progress of viscosity measurement:1. RsVisco creates the real-time graph of data received from A&D's SV-series viscometer via RS-232C. RxVisco lets you graphically monitor in real time:Progress of change in viscosity during measurementTemperature dataTemperature and viscosity, graphed together2. You can choose from three types of graphs:Viscosity (Y axis) - Time (X axis)Viscosity/Temperature (Y axis) - Time (X axis)Viscosity (Y axis) - Temperature (X axis)3. Graphs can be overlaid in repeating measurements, in 10 colors.4. Measured data can be saved in a CSV format file.5. Displayed graphs can be printed with a printer via a PC.Example of Measurement Display Using RsVisco(1) Example of RsVisco DisplayRsVisco software reads the measured results (CSV file) and creates a graph representing the measuring viscosity in real-time, as shown in the figures below. Figures 1 and 2 show the graphs representing viscosity changes of silicon oil (a Newtonian fluid) measured at room temperature while leaving it cooling down from about 45°C to 25°C. Figure 1 shows the elapsed time plotted along the x-axis, with the viscosity (left) and temperature (right) plotted along the y-axis. Figure 2 presents the same data by plotting the temperature along the x-axis and the viscosity along the y-axis. These graphs ideally present the linearity of the correlation between changes in viscosity in response to changes in temperature.
Reviews
Questions & Answers
Valve for IF-1 Rivet Tools
$7.85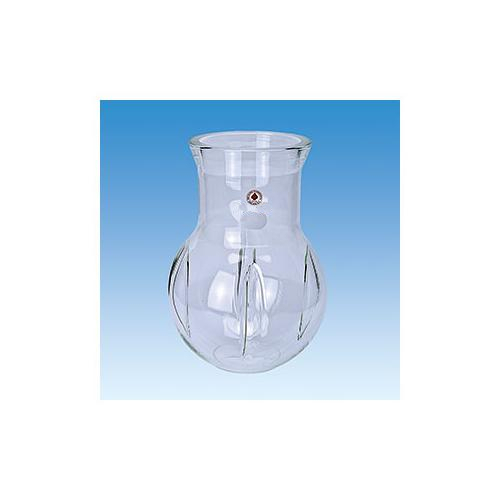
Reaction Spherical Flask, Indents
$365.30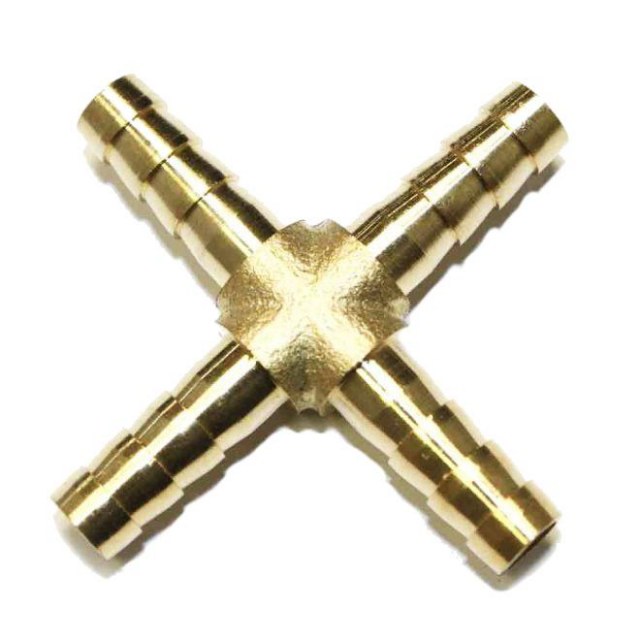
1/4" Brass Hose Barb Cross Fitting
$3.10
"Danger Do Not Enter" Safety Sign
$38.69
Adhesive Vinyl Sign "Danger Workers Overhead"
$10.26
XTH3BT Pistol Grip 4
$3,010.00
Reflective Aluminum Sign "No Parking Any Time"
$57.35
Calorimeter with Heating Coil
$352.30
Sign "Do Not Enter Restroom Closed"
$71.68
Projection Sign "Fire Extinguisher"
$48.02
Electric Diesel Pump w/Suction
$355.50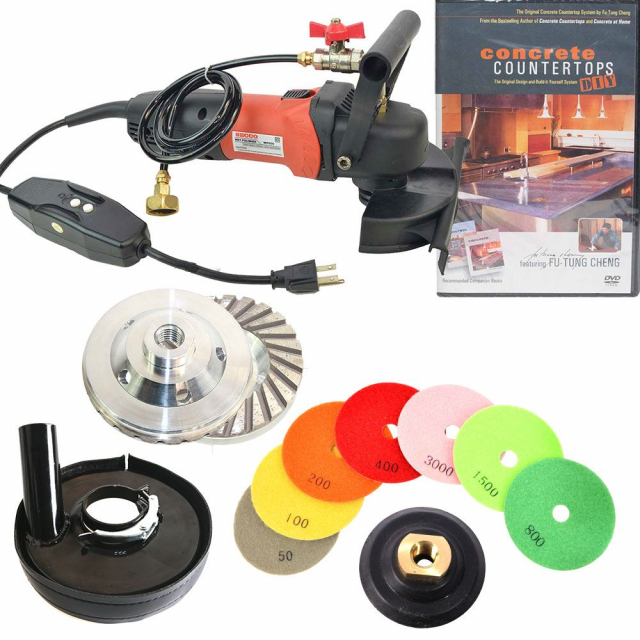
WP800 Var Speed Polisher, Turbo Cup Wheel
$212.50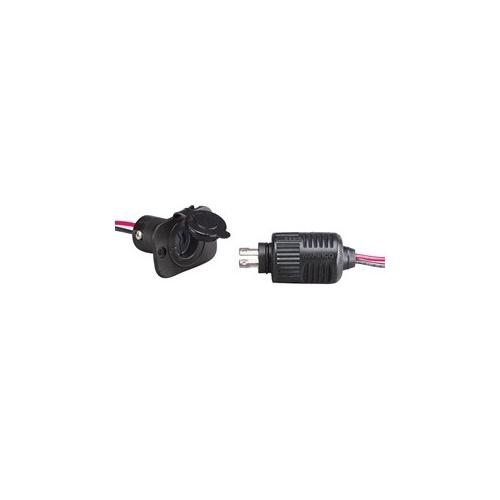
ConnectPro 2 Wire Receptacle and Plug Combo
$43.23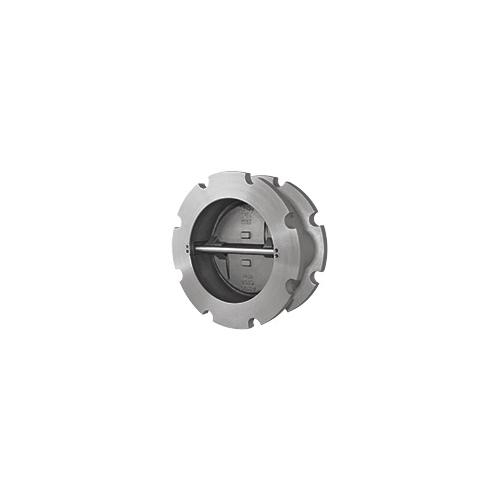
CV42-CS 2-1/2" Wafer Type Check Valve
$302.10
Dura-Plastic Safety Sign "Emergency Exit Only"
$20.08
2-1/4" ANSI Pipe Marker "Medical Vacuum"
$14.43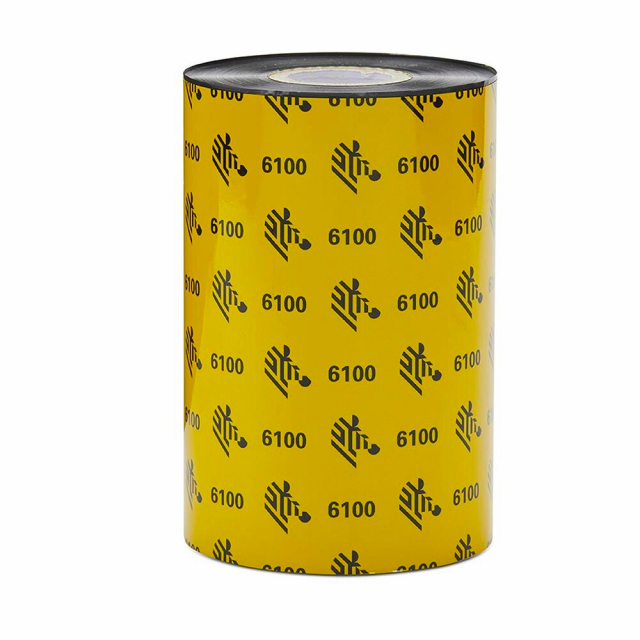
Resin Ribbon 110 mm x 450m (4.33 in x 1476ft) Resin
$314.70
Dura-Vinyl Sign "This Sink is for Hand Wash Only"
$17.65
18W 6500-7000K LEDs Ceiling Light Flush Mounting Square Ceiling Lamp for Kitchen Bedroom Hallway
$21.45
GammaGuard CE Frock
$304.10
Pipette Tips, Non-sterile, 10 ul
$34.45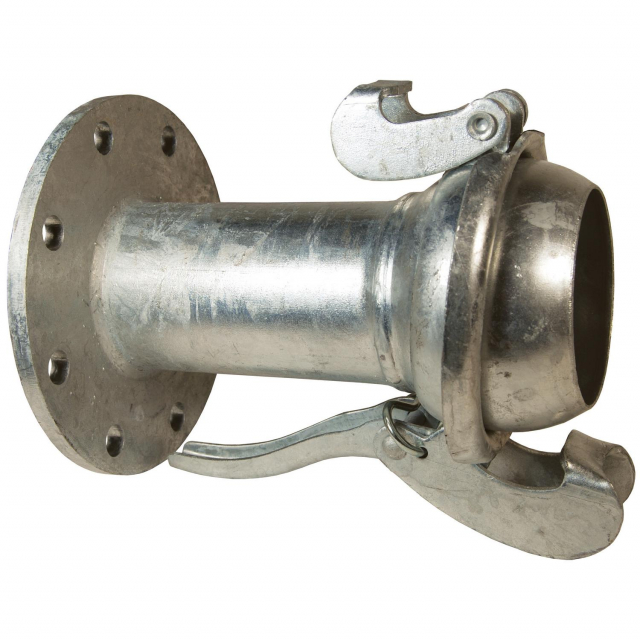
Quick Connect Fitting Type B Male w/150 Asa Flange
$192.90
Safety Label "This Vehicle Makes ..."
$27.12
97093 Number & Letter Label w/ Legend: 3
$9.44
Slip-Gard Floor Sign "Mop Bucket"
$22.80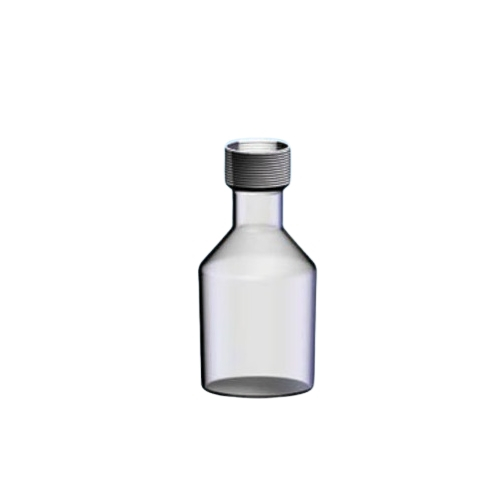
Air Sampling Collection Bottle, 25 mm
$96.54
6554 Still Body Only 24/40 Joints
$309.90
Short-Sleeved Jersey, Long, S
$221.40